How to Scale Revenue with a Refined Market Segmentation Strategy – Bemz Design
Janina Ferneck
Digital Specialist
After doing performance marketing for several years, Bemz – a fashion-forward design company that sells made-to-order covers for IKEA furniture – asked Precis to help them increase their revenue in 2020 by +20%. As paid digital marketing currently constitutes up to 30% of their current revenue stream, we started brainstorming how this could best be achieved. Bemz is an e-commerce business that advertises in and ships to over 40 countries. Without prioritizing specific markets, the budget would have been stretched quite thin – making it more and more difficult to perform profitably in each market. As such, we decided to refine their overall market strategy.
After conducting some initial research, we established that the best set up would be to structure the markets into three different categories – primary markets (A), secondary markets (B), and emerging markets (E) – with the goal of each category having a different focus in terms of budget, channels, and KPIs. Our aim was to be able to continue serving smaller markets, but to keep our primary budget and brand focus on the markets where we identified a higher buying intent.
Category A – Primary focus markets; capitalizing on existing brand awareness* – 60% of the budget – Cost of Sale target: 30% (combined) All channels – lower funnel focus – Google Search (Brand, Non-Brand), Google Display, Shopping, Facebook
Category E – Emerging markets treated similarly to category A markets, but with a focus on growing brand awareness – 25% of the budget – Cost of Sale target: 50% (combined) – All channels – upper funnel focus – Google Search (Brand, Non-Brand), Google Display, Shopping, Facebook
Category B – Secondary focus markets; present but not building brand awareness actively – 15% of the budget – Cost of Sale target: 30% (combined) – “Pull” channels – lower funnel focus -Google Search (Brand) & Shopping
*These have been primary-focus markets for many years, and there is therefore less need to focus on branding.
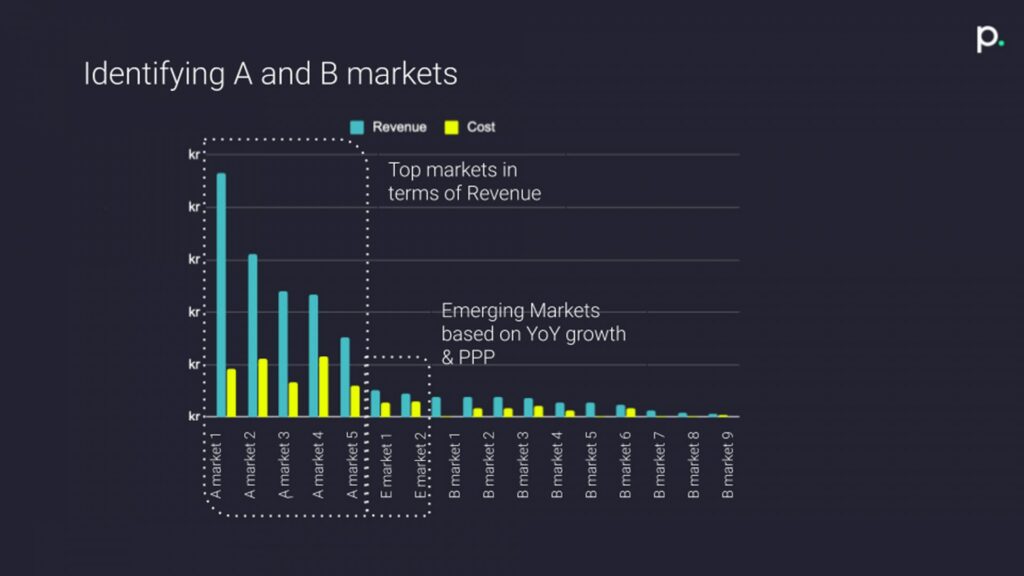
With revenue growth and set Costs of Sale as the primary targets, we chose different metrics to look at to organize and segment the different markets. We needed to take several factors into account and analyze macro-level data that would tell us something about the target audience on a very general level. This included:
- YoY growth
- Total revenue
- Purchasing power parity (PPP) – a measurement that uses the prices of specific goods to compare the absolute purchasing power in the different countries’ currencies.
- Income spent on housing
By analyzing this kind of data, we were able to identify which markets belong in which category and what marketing balance each category should get. This helped us make sure that we put our time and resources into the right place, and has helped streamline and optimize the marketing budget spend and ad production cost.
 Image 1
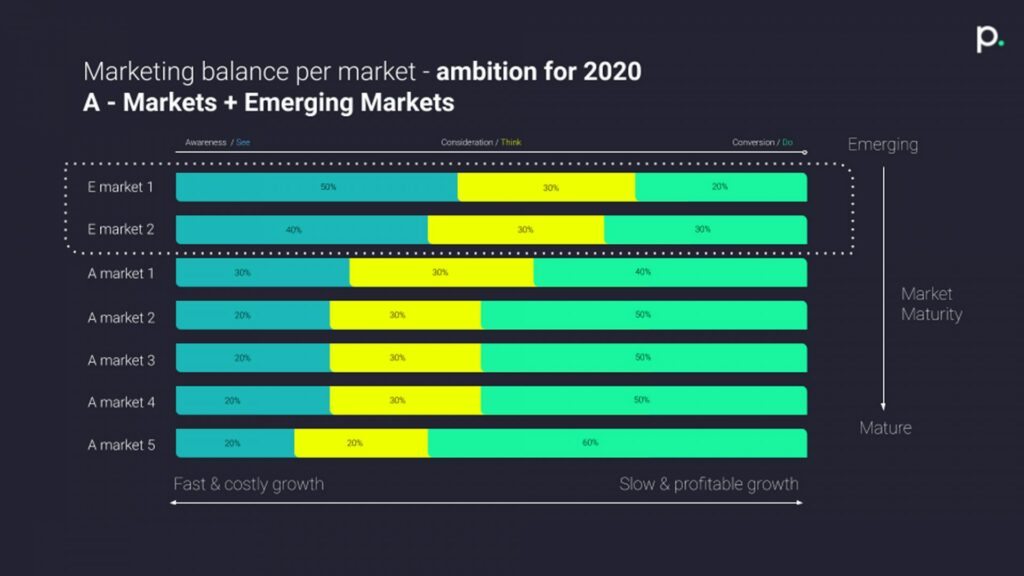
The reasons behind choosing PPP and spending on housing as macro metrics is to understand the broader potential of markets for Bemz beyond our own marketing data. For Bemz, it is particularly important that the markets they’re investing in have a population that 1) has a high enough income to buy goods & products not just for convenience but for preference (and perhaps even indulgence), and 2) perhaps more importantly, is willing to spend money on home decor products. This was particularly influential when we were determining new emerging markets (category E), as those are markets that had had high growth in revenue year-over-year and that we ultimately aim to convert into A markets. Naturally, emerging markets have a lower level of brand awareness than A markets, so to get them to the A market level in terms of revenue and profitability, they therefore need to grow long-term sales volume. This means increasing brand awareness in those markets is essential; by increasing the volume of people we can increase the volume of potential buyers. See image 2 for how we allocated the marketing balance in the different markets.
 Image 2
To sum this up, a good market segmentation strategy allows us to:
- Be able to determine market opportunities & weaknesses
- Adjust goals depending on the above
- Adjust communication per market – messaging, content
- Select media channels strategically
- Pick the right timing and budgeting for marketing efforts
- Efficiently use resources
Results – Q1 2020
2020 has been a big year for Bemz. Not only did we revamp the entire digital account according to the updated market segmentation strategy, but we also had to face the world’s largest economic crisis since the Great Depression: the coronavirus. With this new setup, however, we had a solid foundation to conquer uncertain times.
So far, we’ve seen tremendous results in the first couple of months post-changes: A markets reached a collective Cost of Sale of 27% while growing revenue by +15%. At the same time, B markets achieved a 29% Cost of Sale and even had a +3% revenue growth while marketing costs declined. Last but not least, E markets – which have a focus on brand awareness and growth, meaning that long-term profit will involve higher initial costs – landed at a 54% Cost of Sale and have already grown by an astonishing +454% in revenue. This left us at a total revenue growth of +24% – well above target and expectations!
Considering recent events, we’re thrilled to see that the performance of the markets in the different digital channels is stable, confirming that our new strategy and account setup is working.
(Q1 results based on Google Analytics data).


